Audit Results, Course History and Minors
Understanding Your Degree Audit
Undergraduate Students
Graduate Students
A printable (PDF) version of this documentation is also available: Your Online Degree Audit.
Audit Results
When you first open an audit, you will be on the ‘Audit Results’ tab.

The following information will be at the top of the page:
- Program title: The title of the program, typically includes the major, degree type and college.
- ‘Print Preview’ button: Opens a more printer-friendly version of your online degree audit if formatted as
a Web Audit.
- This printer-friendly view is different from the Audit PDF format you can choose to run an audit in. It preserves the design of the online audit but does not include the charts at the top of the audit or the status icons. Since status icons show at a glance if a requirement or sub-requirement is complete, please read the printer-friendly audit closely.
- ‘Audit Run Info’ button: Details about that audit, including the date and time prepared, the program code (a
shorthand name for the college, degree and major), and the catalog year.
- This information is included at the top of the Audit PDF format.
- Prepared On: The date and time the audit was run.
- Catalog Year: The catalog year the audit was run for.
- ‘Request Audit’ button: Returns to the ‘Request an Audit’ page where you can run a new audit.
- ‘Course History’ button: Goes to the ‘Course History’ tab, which shows the courses used for the audit.
- ‘Minors’ button: Goes to the ‘Minors’ tab, which shows the minors the audit was run with.
- Note: Minors can only be included on audits run for your declared program(s), if you have any.
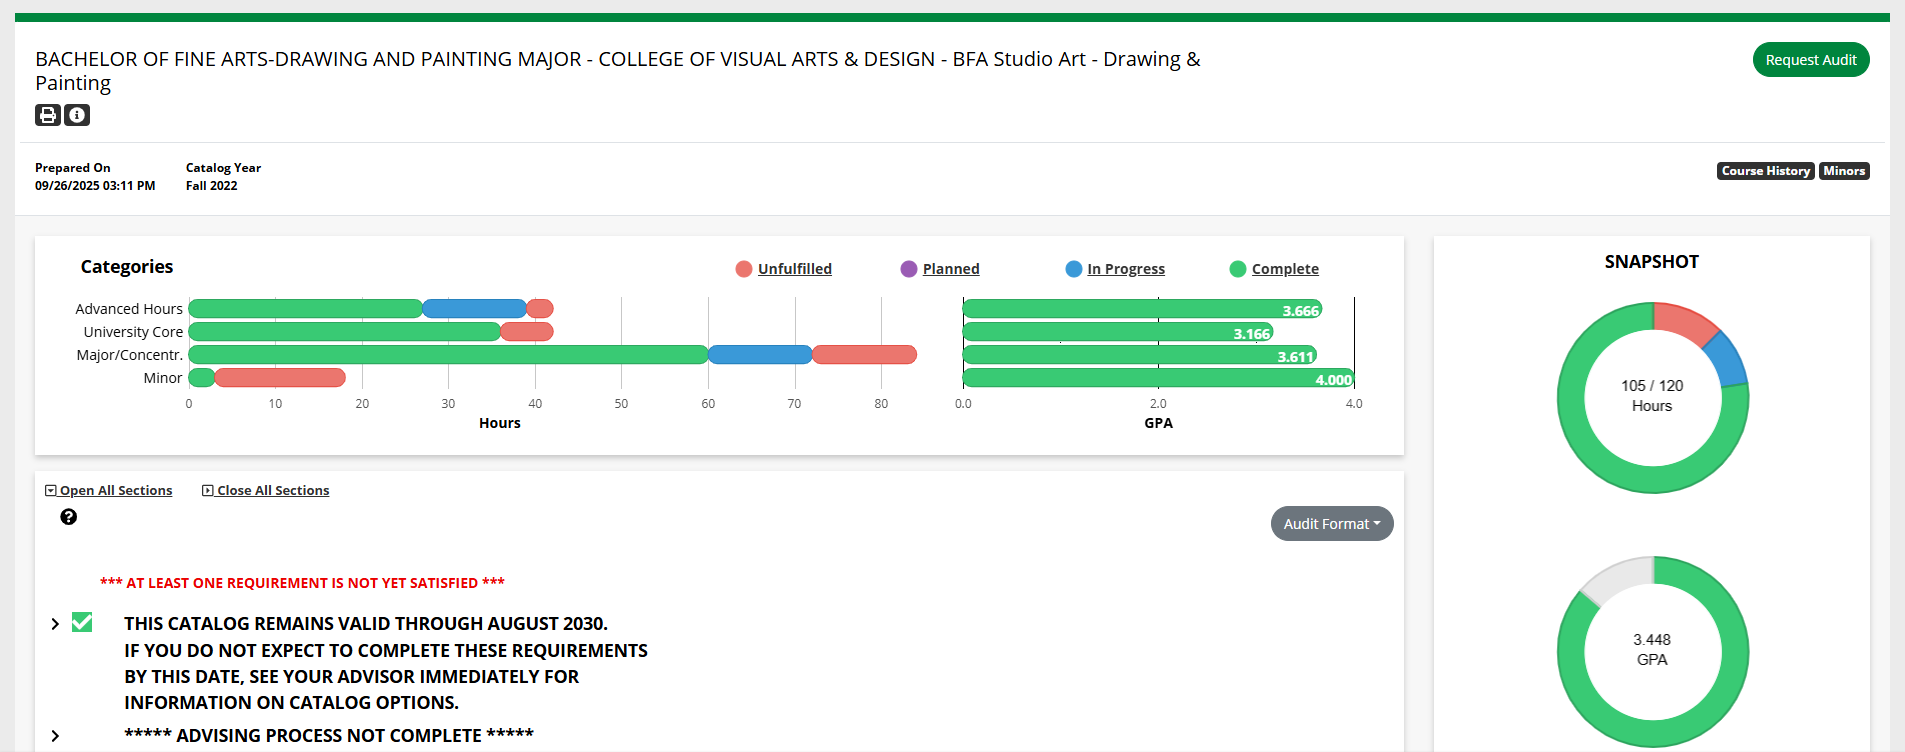
- Charts: Shows your hours and GPA, both overall, as donut charts and by category as bar charts.
Charts
The charts at the top of the ‘Audit Results’ tab show how close you are to finishing the requirements for your degree, as well as your GPA. The legend above the charts shows the colors that represent each status (unfulfilled, in progress and complete).
![]()
Note: The “Planned” status is not used at UNT.
Categories Charts
The Categories charts show your overall hours and GPA per category used for your audit. Categories can include “Advanced Hours,” “University Core,” “College Core,” “Major/Concentr.,” “Minor” and so on. If a category doesn’t apply to your audit, it will not be shown.

Snapshot Chart
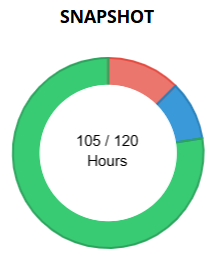
The Snapshot donut chart shows the number of credit hours you’ve earned relative to the number of hours in progress and unfulfilled. The center of the chart shows the number of hours earned and in progress, along with the total number of hours required for your degree. When you hover your mouse over a section of the chart, it will show the number of hours for that status, such as “42 complete” or “24 unfulfilled.”

Overall GPA Chart
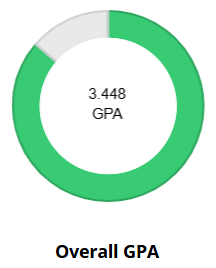
The Overall GPA donut chart shows your overall GPA. Your exact GPA is shown in the center of the chart.

Note: Your GPA on your degree audit may vary from your GPA elsewhere. See “My GPA is different on my degree audit, my unofficial transcript, and/or myUNT.” for more information.
Other Tabs on the Audit
You can switch between viewing your audit and viewing your course history and any minors applied to the program for which you ran the audit.
To view your course history:
- In the upper-right corner, below the ‘Request Audit’ button, click the ‘Course History’
button.

To view any minors applied to the audit:
- In the upper-right corner, below the ‘Request Audit’ button, click the ‘Minors’ button.

Note: Minors cannot be applied to “what-if” audits.
To view your audit again:
- In the upper-right corner, below the ‘Request Audit’ button, click the ‘Audit Results’
button.

Course History
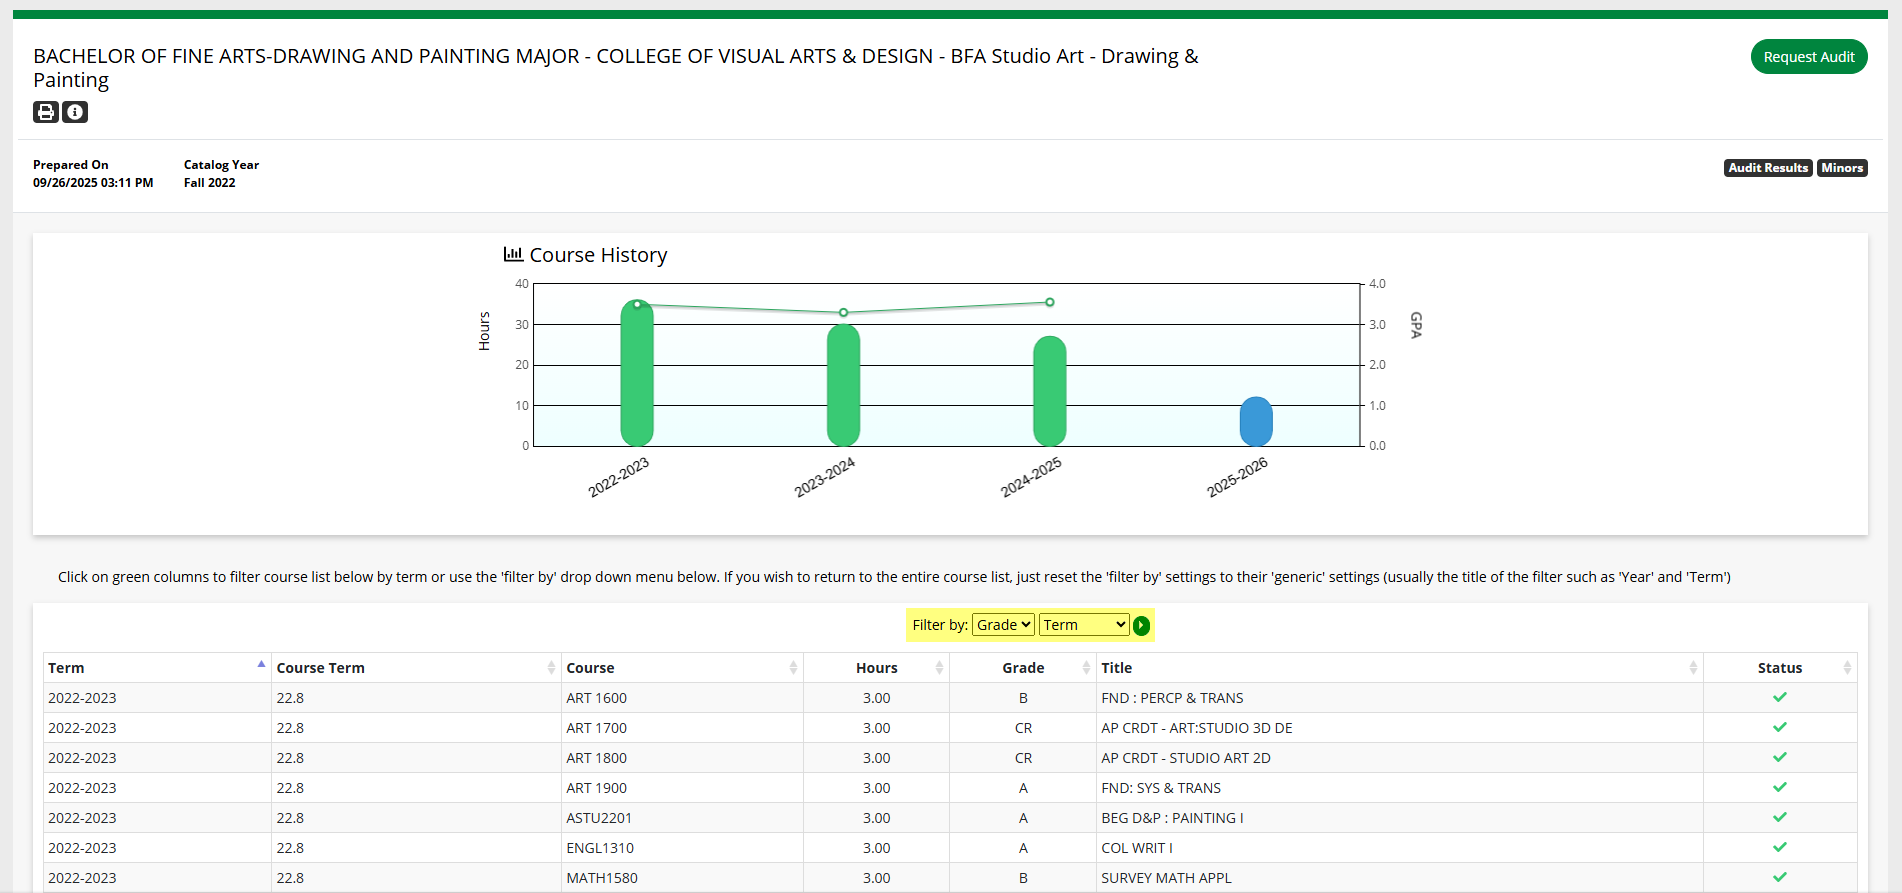
‘Course History’ shows a list of all the courses you have taken at UNT, as well as courses taken at other institutions once any official transcripts have been processed. This course history is the information used by the audit to compare your progress to the program requirements.

The chart summarizes your credit hours and GPA for individual years. Each bar represents the number of credit hours completed for a specific year and each point on the line graph represents your GPA for that year. Similar to the charts on the audit, you can click on the bars in the course history chart to isolate the information below to just courses taken in that year.
The table shows information about all the courses that are in your academic record. The information is displayed similarly to the course information on the audit, including the term (catalog year), course term*, subject and course number, number of credit hours, grade earned, course title and status (complete or in progress). You can check this table if you’re not sure whether a transfer course has been added to your record. You can use the “Filter by” dropdown menus, highlighted in the image above, to filter the course history table as well.
*The course term is an abbreviation for the year and term the course was taken. See the Course abbreviations on the audit section for more information.
Minors
The ‘Minors’ tab shows any minors applied to the audit. For certain programs, additional information other than minors may be shown.

If the audit was run with at least one minor, there will be a table showing the minor information:
- Marker: The placeholder on the audit where the minor requirements are processed.
- Value: The shorthand name for the minor, similar to the program code.
- Type: Setting that instructs the degree audit system how to process the minor.
- CATLYT: The catalog year/term for the minor. If the catalog year is the same for both the minor and the program, the ‘CATLYT’ column may be blank.
If the audit was not run with a minor, instead of a table, there will be a notice stating, “No Minors found.”
Embedded minors
Some majors require a specific minor, so the minor is embedded or built directly into the audit. If a major has an embedded minor, the minor will not be listed when you click the ‘Minors’ button. However, the minor requirements will be listed on the audit. The ‘Minors’ button only shows minors added separately, not embedded minors. For example, the B.A. in Biology requires a minor in Chemistry, so it is embedded directly into the audit. The Chemistry minor will not be listed on the ‘Minors’ tab, but the Chemistry minor requirements will be on the audit.
Have more questions about your degree audit? Your advisor will be able to explain your audit and help you decide on the best course of action to help you achieve your goals. You can find a list of advising offices on the Get Advised page.